数据可视化工具:d3js

| No Comments | No TrackBacks

可视化的数据可以让数据分析的结果更加直观,便于发觉隐含内容;最近需要对聚类算法的结果数据进行进一步的分析,探索了一些可视化的工具或组件,最后选择了d3js。


Data-Driven Documents(d3)是一个JavaScript类库,基于W3C标准,使用HTML、SVG和CSS把数据转换为各种绚丽的图形。


支持的数据格式有常见的:txt、html、json、html、xml、csv等


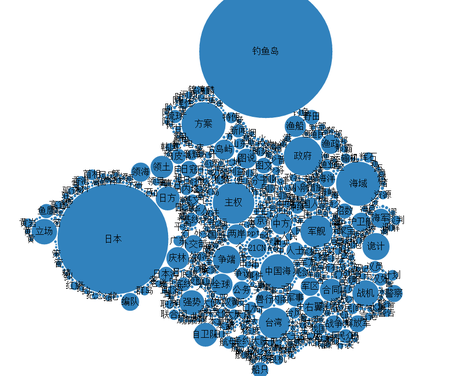
直接调用d3库制作的Bubble图(如下):

cluster_20121119182946.png


2万条数据耗时10秒左右(肉眼估测);


更多内容请见:

官方主页:http://d3js.org/


在线示例:https://github.com/mbostock/d3/wiki/Gallery

No TrackBacks

TrackBack URL: https://www.thinkjam.org/tjmanage/trackbacks/1275

Leave a comment

About this Entry

This page contains a single entry by meteor published on November 19, 2012 6:16 PM.

【转】布隆过滤器 (Bloom Filter) 详解 was the previous entry in this blog.

Java次方运算性能测试 is the next entry in this blog.

Find recent content on the main index or look in the archives to find all content.

Categories

Pages

  • About
  • Contact
OpenID accepted here Learn more about OpenID
Powered by Movable Type 7.6.0